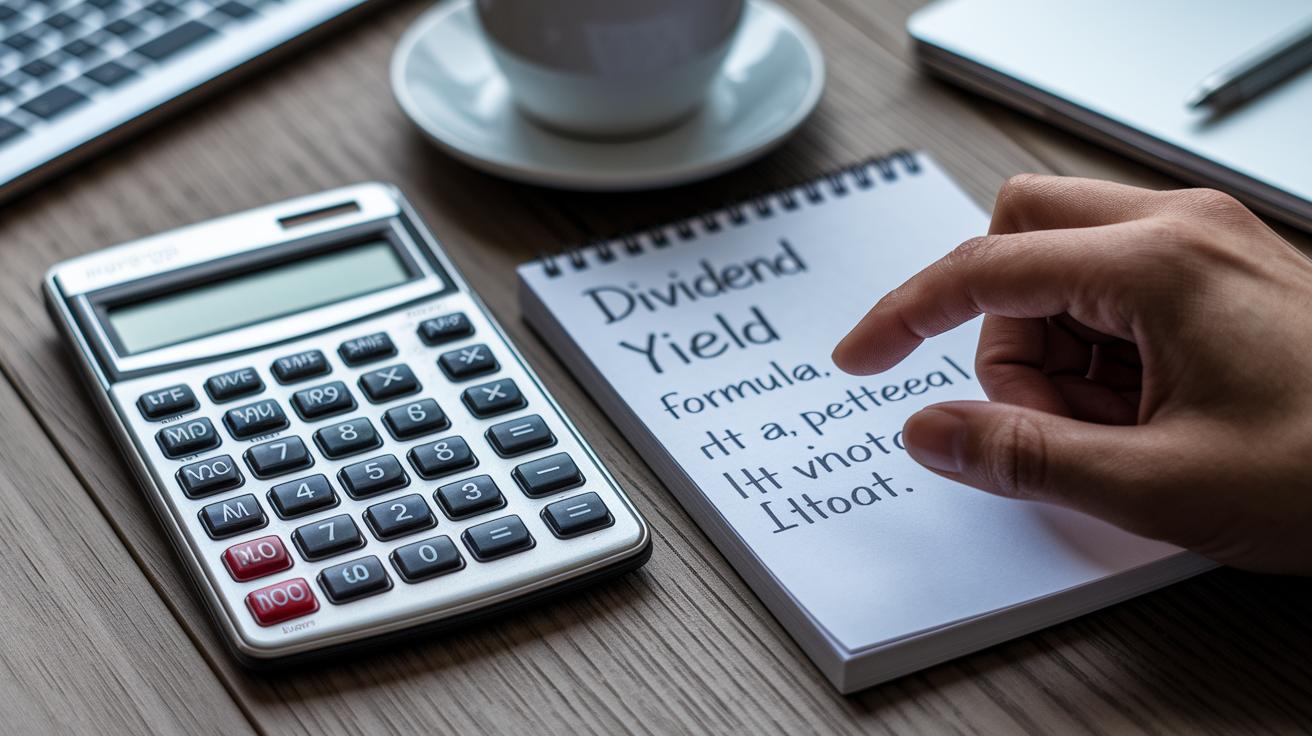
Ever thought about spotting your stock earnings in one quick look? The dividend yield formula is what you need. It tells you how much cash a company pays back to its investors compared to its stock price. Think of it like checking your bank balance; it shows you how much money comes from your shares.
In this post, I'll explain the easy math behind dividend yield and show you how to use it to compare different stocks. It’s a neat trick to help you see which investments might be giving you a better return. Stick around and get ready to view your stocks in a whole new way.
Calculating Dividend Yield: The Formula Explained
Dividend yield shows how much cash a company gives back to its shareholders each year. It compares the money you get in dividends to the price you pay for a share. In other words, it gives you a quick look at the income you might earn from owning the stock.
It’s also a handy tool when you’re checking out similar companies. By comparing yields, you can see if one stock offers a more attractive payout than another. This is especially useful for folks who focus on stocks that generate regular income.
The math is simple. You divide the annual dividend per share by the current share price. For instance, if a company has a 5% yield, that means for every $1 you invest, you get 5 cents back in dividends.
Let’s say a company pays $2.00 per share every year and the share price is $100.00. When you do the math – $2.00 divided by $100.00 – you get 0.02. Multiply that by 100 and you see a 2% yield. This means that for every dollar you invest, you get 2 cents in dividend income over the year. It’s a neat little calculation that helps you understand what you’re really earning on your investment.
Breaking Down the Components of the Dividend Yield Equation

When we talk about dividend yield, we really just need two numbers: dividends per share (DPS) and the current share price. Both of these numbers need to reflect the same period so you can see exactly what income you get compared to the price of the stock.
DPS is found by adding up all the cash dividends paid over the past 12 months and then dividing that total by the number of shares. For example, if a company paid $2.50 a share in dividends this year, that total comes from all the dividend payments during that whole period. You can usually find this info in official reports or through market analysis, which makes it clear just how much return the company is giving from its earnings.
The current share price, on the other hand, is simply the price the stock closed at, like $63.61 at the end of 2022. It shows what buyers are willing to pay for the stock at that moment. Keeping the time frames for both DPS and the share price in line is key to getting a reliable dividend yield ratio.
Step-by-Step Guide: Computing Dividend Yield with an Example

Let's break down how to calculate dividend yield in a simple way. First, you need to know the trailing-12-month dividends per share, also called DPS. Next, grab the current share price. Then, divide the DPS by the share price. Finally, change that number into a percentage.
| Scenario | DPS | Price | Yield |
|---|---|---|---|
| Example 1 | $2.00 | $100.00 | 2.00% |
| Example 2 | $2.50 | $63.61 | 3.93% |
A higher yield can happen if the DPS is up or if the share price drops. Just make sure that the DPS and share price are taken from the same period before doing the math.
The Role of Dividend Yield in Investment Decisions

Dividend yield is a handy tool that tells you how much cash you might earn from an investment compared to its price. It works like an income check by comparing what you pay for a share to the money you get from dividends. Think of it as an easy way to figure out if a stock can offer you a steady income.
When you compare dividend yields across companies, it helps you get a feel for each stock’s income potential while also seeing how long the business has been around. Many investors check a company’s dividend yield as part of their homework to make sure it has a solid plan for paying out cash. Even if two stocks show the same yield, a company with a strong track record can feel a lot more reliable. I remember comparing two stocks, one from a stable sector and the other from a rapidly changing field, and the former, with its steady yield over time, really gave me more confidence.
Sometimes, a super high yield might be more trouble than it’s worth. A stock showing a high yield compared to its peers could mean that its share price has taken a hit, which might signal some underlying problems. When the numbers seem too attractive, it’s smart to take a closer look and consider whether that high yield is hinting at extra financial risk.
Comparing Dividend Yield to Related Metrics

Dividend yield is a quick way to see how much cash you get back from your share purchase. It shows how many dollars in dividends (cash payments by the company) you earn for every dollar you spend. You calculate it by dividing the annual dividend per share by the share price. In short, it tells you the cash reward you get compared to your investment.
On the other hand, the dividend payout ratio looks at how much of a company’s profit is paid out as dividends. It tells you the percent of money earned that goes back to you versus what the company keeps for growth or other bills. This helps you figure out how much profit the company plans to share with shareholders instead of saving for future growth.
| Metric | Focus | Calculation |
|---|---|---|
| Dividend Yield | Cash return per share price | Dividends ÷ Price |
| Dividend Payout Ratio | Earnings distribution percentage | Dividends ÷ Earnings |
Looking at these metrics gives you two different views of a company’s financial health. While dividend yield shows the cash you can expect right away, the dividend payout ratio teaches you how the company handles its profits. This way, you can better understand both today's income and the chance for long-term stability.
Factors Influencing Dividend Yield Interpretation

Dividend yield going up because of higher dividends per share tells a positive story. When a company bumps up its DPS, it shows confidence in its earnings and a real commitment to rewarding shareholders. It usually means the company is enjoying healthy cash flow and sticking to a plan of giving back value. A record of steady DPS increases can help investors feel secure about the yield over time.
But if the yield climbs due to a drop in the share price, caution is needed. In that case, the high yield might not mean stronger dividend performance at all but could be a sign of a falling market value hinting at potential trouble. This kind of trend helps investors notice when an attractive yield might actually be a warning sign.
Different industries also shape how you read dividend yields. For example, utilities often deliver stable, higher yields because of steady cash flows. Meanwhile, companies in growth sectors might offer lower yields even when they perform well, since they reinvest profits to spur more expansion.
And then there's the choice between forward yield and trailing yield. Forward yield predicts future dividends (an estimate of what might come), offering a look at expected returns. Trailing yield is based on dividends paid during the past 12 months. Both views give a balanced picture of current performance versus what you might expect down the road.
Final Words
In the action, we explored the dividend yield formula and broke it down into simple parts. We uncovered how dividends per share and the current share price come together in the dividend yield formula to provide a quick snapshot of a stock's income potential.
We walked through step-by-step computation and compared related metrics. Each section helped clarify smart investing choices and credit card management during budget planning. It's great to see how these tools empower us to make positive moves towards financial stability.
FAQ
Q: What is a good dividend yield?
A: A good dividend yield meets your income goals and varies by industry. Typically, yields between 2% and 5% in stable companies are attractive, though what’s ideal for you may differ.
Q: How do I calculate dividend yield?
A: The dividend yield calculation divides the annual dividend per share by the current share price and then multiplies by 100. This simple formula shows how much cash return you get on each dollar invested.
Q: How much is a 4% dividend yield?
A: A 4% dividend yield means that for every $100 invested, you earn $4 in dividends annually. It reflects the cash income return relative to the stock’s price.
Q: How to make $1000 a month in dividends?
A: To earn $1,000 monthly in dividends, you’d need enough capital to produce approximately $12,000 annually. For a 4% yield, this means you may need to invest around $300,000.